07/08/2024
Data analysis and interpretation are critical for a data-driven business approach. It allows businesses to run effectively in the market. In order to fully harness the power of big data, these businesses must employ meticulous business intelligence and analytics.
Tools like Power BI help companies analyze and visualize data in a manner that will deliver meaningful, actionable insights. This article will show you how to perform data modeling on Power BI.
What is Power BI?
![]()
Microsoft Power BI is a data visualization tool developed by Microsoft. It offers the capabilities to centralize your data, create visual inputs that provide actionable insights, and translate that into an impact across the team. It has a user-friendly interface and can be used to create case-specific dashboards and reports so that the data-driven culture is embedded into the company.
What is Data Modeling?
Data modeling is the process of creating a representation of the data elements in a software system and how it flows. Data models serve as a blueprint for designing new databases or reinventing applications. By providing a visual representation of data sets and the associated contextual business information, it helps pinpoint information needs for different business processes.
 The Entity-Relationship Model
The Entity-Relationship (ER) model is a conceptual data modeling technique that aims to represent the relationships between various entities within a system and their attributes. This model provides a clear and visual way to understand the structure of a database and the interactions between different elements, making it an essential tool for database designers and developers.
The fundamental components of the ER model are entities, attributes, and relationships. Entities are objects or concepts in the real world that can be distinguished from one another and can have attributes that describe their properties. Attributes are the characteristics or properties of entities, while relationships define how entities are related to one another.
For instance, let’s consider a simple ER model for a library database:
Entities:
- Book
- Author
- Category
Attributes:
Book – ISBN, Title, Publication Year
Author – Author ID, Name, Nationality
Category – Category ID, Genre
Relationships:
– A Book is written by an Author (Many-to-One)
– A Book belongs to a Category (Many-to-One)
Here’s an example of how the ER model could be visually represented in a tabular form:
| Book | Author | Category |
| ISBN | Author ID | Category ID |
| Title | Name | Genre |
| Publication Year | Nationality |
In this example, we can see how the Book entity is related to the Author and Category entities through specific attributes (ISBN, Title, etc.).
What is Cardinality?
Cardinality refers to the numerical relationship between entities in a database. It defines how many instances of one entity are associated with another entity through a relationship.
Cardinality is expressed in terms of “one” (1) or “many” (N).
In the example of a library database, the cardinality can be described as follows:
- The relationship between Book and Author has a cardinality of “many-to-one” (N:1), indicating that many books can be written by a single author.
- The relationship between Book and Category also has a cardinality of “many-to-one” (N:1), meaning that many books can belong to a single category.
Cardinality helps database designers understand the nature of associations between entities and plays a crucial role in determining how data is stored and retrieved in the database, ensuring data integrity and consistency.
Types of Keys
Primary Key: A primary key is a unique attribute within an entity that uniquely identifies each instance of that entity. It serves as the main identifier for the entity and ensures that each record is distinct and identifiable.
Foreign Key: A foreign key is an attribute within an entity that establishes a link to the primary key of another entity. It helps create relationships between different entities in the database and maintains referential integrity.
Composite Key: A composite key is a combination of two or more attributes that together act as a unique identifier for an entity. This type of key is used when no single attribute can uniquely identify the entity, but their combination does so effectively.
These keys play a crucial role in defining relationships between entities, ensuring data accuracy, and enabling efficient querying and retrieval of information from the database.
How to start with Power BI
Power BI can be accessed either by downloading the web application or through a browser. While both versions offer the same functionalities of creating, managing, and saving data visualization, the downloaded version offers more features and tools than the browser version.
For this exercise, we will be using the installed version of Power BI. Familiarize yourself with these basic steps before you begin data modeling:
Install the desktop version of Power BI
You can download Power BI from the Microsoft Store using a corporate or school email address. If you don’t have one, you will need to sign up through the Microsoft Azure Portal (for free) with the onmicrosoft.com domain.
Know basic Power BI functions
- The first icon on the left side panel is the “Reports” tab, where you can see the visualizations and reports created.
- The second icon is the “Data” tab to create and manage imported data
- The third icon is the “Model” tab to manage data models and relationships.
- The central area can be used for filling in reports and visualizations.
- The “Visualizations” tab on the right side helps create different kinds of charts and report designs.
- The “Data” tab on the right side shows all the datasets that you have imported.
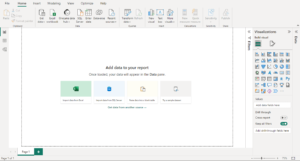
Import Sample Data
You can use the ‘Get Data’ button on the ‘Home’ tab to import data. Power BI will show you a number of options to import data in different formats. Once you choose the format that you have your data in, you can click on the ‘Load’ button if the data is ready to use in that form, or else, click on ‘Transform Data’ to change it as you need.


The sample data used in this exercise can be downloaded from this link.
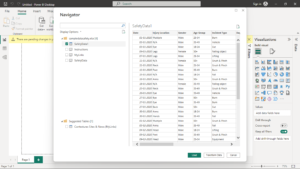
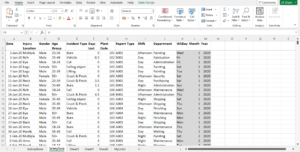
In this example, we will be using sample data in an Excel sheet. Power BI has the capability to recognize the data automatically and understand the relations in the table as soon as it is imported.
An Introduction to Data Modeling in PowerBI
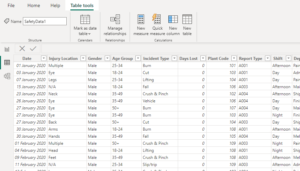
We will be using the sample data from the previous section, on a workplace safety report.
- There are 14 columns, indicating date, injury location, gender, age group, incident type, etc, including 3 columns with a calculation.
- There are 514 rows for each person injured over the year.
Data Models
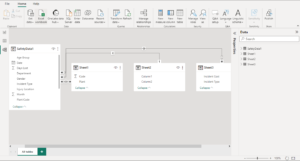
After importing data, the ‘Models’ tab, the third icon on the left side panel will take you to the automated relations detected by Power BI between the various data tables. All the lines here depict the direction of the relation between the tables, and the cardinality. The ‘Manage relationships’ tab at the top allows you to edit these default relationships.
Creating and managing relationships
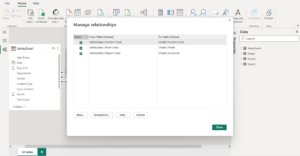
If you click on ‘Manage relationships’, the dialog box above appears. The various functions you can perform here are:
- New: To create new relationships between the tables
- Autodetect: To make PowerBI automatically detect the relationships
- Edit: To edit the relationships
- Delete: To delete the selected relationship
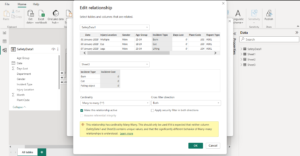
If you click on ‘new’ or ‘edit’, the dialog box above will appear.
- Select the table you want to edit in the first drop-down menu.
- Create the relation between the first and second tables in the second menu.
- The cardinality of the relation can be set here. Please note that if a specific cardinality between the tables is not possible, it will not be available.
- Select the direction of the relation: either single, from the first table to the second or vice versa, or both ways.
Calculating and measuring data
The Data Analysis Expression Formula (DAX) can help in calculating data in the tables. They offer options for adding, multiplying, averages, percentages, and so on, with various filters.
If we click on the second icon in the left side panel, it will take us to a workspace for data calculations.
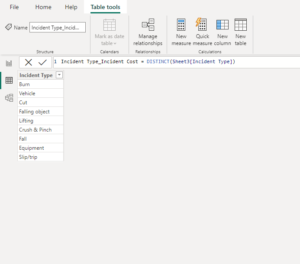
Using the expression, DISTINCT(Sheet3[Incident Type]), we are able to create a table of all the unique values in the ‘Incident Type’ column.
In the above expression, “1 Incident Type_Incident Cost” is the name of the table.
“DISTINCT” is the filter used so that only the unique values in the column are selected. Inside the brackets of the function, we will write the parameters, which is the location of the data.
“(Sheet3[Incident Type])” refers to the column and table location of the data.
If you wish to rename this column, you can double-click on it.
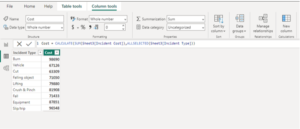
To create a calculated column, you can click on ‘New Column’ from the top menu.
We will use the DAX expression in the above image to calculate all the costs incurred to the company by each type of incident.
The “Quick Measure” tool under “Table Tools” in the top menu can help you with writing the DAX expression by selecting the function you require.
Creating a visualization
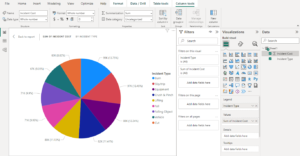
Here we have created a pie chart demonstrating the costs incurred by the company due to each incident type, which can be a helpful visual data representation. PowerBI offers a wide variety of options for visualizations and different data models, allowing you to handle far more complex datasets and create visualizations that are able to communicate the data far more effectively.
Conclusion
Effective data modeling involves understanding the data sources, creating relationships between tables, and crafting measures and calculated columns to derive valuable metrics. Through this process, users can build robust and dynamic reports, dashboards, and visualizations, facilitating a deeper understanding of business performance and trends.
Power BI’s user-friendly interface and intuitive features make data modeling accessible to a wide range of users, regardless of their technical expertise. This democratization of data enables teams across the organization to collaborate seamlessly, fostering a data-driven culture and empowering everyone to contribute to data-driven decision-making.
As data continues to grow exponentially, the importance of sound data modeling in Power BI becomes even more evident. Organizations that invest in developing efficient data models will reap the rewards of improved data accuracy, enhanced productivity, and a greater ability to adapt to evolving business needs.
Embracing data modeling in Power BI is not just a best practice; it is a strategic imperative for businesses seeking to thrive in today’s data-driven landscape.
Need PowerBI Consultants? Technoforte is the cream of the crop.
Technoforte’s expert PowerBI consultants can create dashboards specific to various organizational levels. We offer the services of:
- Data Warehousing: Extracting, transforming, and loading data
- Data Analytics and Design: Data from multiple sources is turned into actionable insights with the right visualization
- Predictive Analytics: Using statistical modeling and machine learning based on historical data to make predictions
- Big Data: Analyzing high volumes of structured and unstructured data
- Data Integration and Migration: Migration from one tool to another
- Data Governance: Consulting on data governance policies to enable data-driven decision making
✓ Uncover Hidden Insights
Gain a competitive edge by leveraging the power of data-driven decision-making to boost growth and profitability. Our experts will help you uncover valuable insights that drive growth and improve your bottom line.
✓ Real-Time Analytics
Make informed decisions on the fly with real-time data analytics. React swiftly to market changes and optimize your strategies for maximum effectiveness.
✓ Enhanced Decision-Making
Empower your team with the right information at the right time. Our Power BI consulting services facilitate seamless collaboration across your organization, with intuitive dashboards and reports that make it easy for anyone, regardless of technical expertise, to interpret and act upon data insights. Enable a data-driven culture within your organization and foster innovation.
✓ Scalable and Future-Proof
As your business grows, so does your data. Our data analytics and Power BI consulting services are scalable, which means your business intelligence and analytics infrastructure can adapt to increasing data volumes and evolving needs. Also, our future-proof approach ensures that the latest advancements in the applications are incorporated into our services.
✓ Expert Guidance and Support
Our team of experienced data analytics and Power BI consultants will guide you through the implementation process, provide comprehensive training, and offer ongoing support to ensure you get the maximum ROI out of your business intelligence and analytics solution.
✓ Increased Efficiency
Streamline your data processes and improve efficiency. Save time and effort with automated reporting. Dynamic reports and dashboards update in real-time, ensuring that you always have the most up-to-date insights at your fingertips. With our data analytics and Power BI consulting services, you can automate repetitive tasks, eliminate manual data processing, and reduce the risk of errors. Focus your efforts on high-value activities and maximize productivity.
Click here to get in touch with us.